Lambeth Tigers U11s — Match Reports
- Only four players are confirmed real this match: Jack (tracked directly, not by number), #2 Issac, #7 Jaden, and #23 Evan (goalkeeper). These are used by name throughout this report.
- Team-level totals (score, shots, passes, possession) come from Veo's automatic tracking and are independent of jersey tagging, so treat those as reliable regardless of the naming gaps above.
Match summary
Pure FC struck early from inside the box and held their lead through a first half where Lambeth Tigers spent too much possession in their own defensive third. The Tigers were much the better side after the break — more of the ball, more final-third play — and Issac's stoppage-time free kick secured a 1–1 draw away from home.
Team totals
| Team | Goals | Shots | Total attempts | Conversion |
|---|---|---|---|---|
| Lambeth Tigers (attacking) | 1 | 12 | 13 | 8% |
| Pure FC (shots faced by Tigers) | 1 | 9 | 10 | 10% |
Form & trend
Compared against the previous match (vs Junior Elite, Sep 20) using Veo's own match-over-match tracking, plus the half-by-half picture from Veo's Coach Assist analysis of this match.
| Metric | This match | Last match | Change |
|---|---|---|---|
| Possession | 59% | 56% | +3% |
| Passes completed | 114 | 106 | +8 |
| Longest pass string | 10 | 5 | +5 |
| Conversion rate | 8% | 7% | +1% |
Passing improved noticeably — both in volume and in sustaining longer strings (5 → 10) — but conversion is still low. Coach Assist's own read of this match gives possession as 57.8% and total attempts as 12 (vs 59% / 13 from the isolated Analytics Studio view above) — a small gap between Veo's two views, close enough not to worry about; the Analytics Studio figures are treated as the team-total source of record throughout this report.
A game of two halves
| Period | Possession | Attacking-3rd share | Attempts |
|---|---|---|---|
| First half | 52% | 11.6% | — |
| Second half | 64.6% | — | 6 |
A slow first half — 55.9% of our possession sat in our own defensive third, and Pure FC took the lead from inside the box during it. The second half flipped that: possession rose to 64.6%, we completed 61 passes and created 6 attempts, and Issac's equaliser — a free kick, not an open-play finish — came right at the end. Pure FC also had a productive first half themselves (65 passes, 8 attempts), so the improvement was a genuine second-half shift rather than a one-sided game throughout.
Veo's narrative rating (AI-generated, not a fixed formula)
Game plan execution: 7/10 — the high press was visible, especially after half-time, but possession stayed too deep for too long and the press didn't consistently stop Pure FC's attacks in the first half.
Same caveat as last match — this is Veo's own qualitative score, logged here as commentary rather than something to chart as a trend line.
Expected goals (xG) — estimated
Same zone-based method as last time (0.10 inside the box, 0.06 edge/D, 0.03 outside), built from each team's shot map.
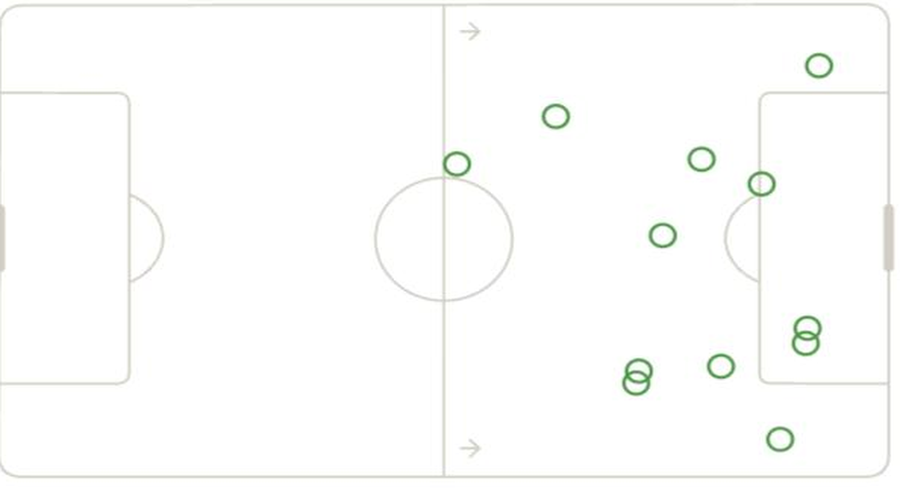
Lambeth Tigers shot map — all attempts
Zone breakdown & estimated xG
| Zone | Shots | xG/shot | Zone xG |
|---|---|---|---|
| Inside penalty box | 4 | 0.10 | 0.40 |
| Edge of box / D | 5 | 0.06 | 0.30 |
| Outside box (18yd+) | 3 | 0.03 | 0.09 |
Estimated xG ≈ 0.8 from 12 shots, vs. 1 goal actually scored — roughly in line with expectation. Chance quality was similar to last match: about a third of attempts came from inside the box, the rest from further out.
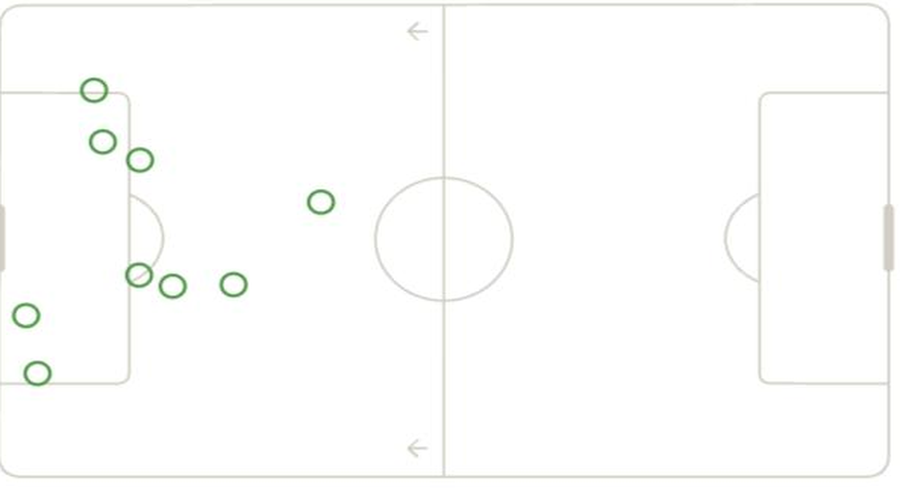
Pure FC shot map — all attempts
Zone breakdown & estimated xG
| Zone | Shots | xG/shot | Zone xG |
|---|---|---|---|
| Inside penalty box | 6 | 0.10 | 0.60 |
| Edge of box / D | 2 | 0.06 | 0.12 |
| Outside box (18yd+) | 1 | 0.03 | 0.03 |
Estimated xG ≈ 0.8 from 9 shots, vs. 1 goal actually scored — also roughly in line with expectation, though Pure FC's chances skewed more central (two-thirds from inside the box) despite having fewer shots than the Tigers.
Player breakdown
Four players confirmed real this match. Raw totals aren't comparable across matches on their own since minutes played vary — the per-90 columns are the ones to track over time. Evan is new to this report as goalkeeper (#23); his outfield-style columns (shots, dribbles, tackles) are naturally near zero and not meaningful for his role.
| Player | Min | Shots | Goals | Conv. | Passes | Pass % | Dist (km) | Dist/min | Top speed | Sprints | HI runs | HI/90 | Tackles | Int. |
|---|---|---|---|---|---|---|---|---|---|---|---|---|---|---|
| Jack #9 | 50 | 4 | 0 | 0% | 7 | 58% | 5.7 | 114m | 32.7km/h | 6 | 25 | 45.0 | 6 | 3 |
| Issac #2 | 50 | 3 | 1* | 33%* | 24 | 71% | 5.2 | 104m | 27.5km/h | 4 | 13 | 23.4 | 3 | 5 |
| Jaden #7 | 50 | 4 | 0 | 0% | 4 | 36% | 5.6 | 112m | 27.5km/h | 2 | 10 | 18.0 | 7 | 2 |
| Evan #23 · GK | 50 | 0 | 0 | — | 24 | 83% | 2.0 | 40m | 14.7km/h | — | 0 | 0.0 | 0 | 3 |
*Issac's goal is confirmed by Veo's match-event log (51', a free kick, credited to #2), but the separate per-player stats table still shows 0 goals / 0% conversion for him — corrected here by hand. Jaden had the most touches on the ball among outfield players by shot count (4, level with Jack) but the lowest pass accuracy (36%). Evan's sprint count wasn't captured in this match's export; everything else for him is as Veo recorded it, and his low distance/top speed are expected for a keeper rather than a data gap.
Fix the data next time
- Make sure every kid has a visible, correctly-sized number on their kit — Veo reads it from the video, it isn't entered by hand. Still on hold until new kit arrives.
- Once numbers + names are linked in the roster, this same report will resolve to real player names automatically on future exports — the numbers-on-kit fix is still the bigger unlock, since without visible numbers there's nothing for a roster entry to attach to.
- Four numbers have been matched to real players from the squad list: #2 Issac, #7 Jaden, #9 Jack, #29 Max. These are used by name throughout this report.
- The remaining tagged numbers (#5, #10, #11, #13, #23) are treated as false positives — misreads rather than real distinct players — and have been left out of the player breakdown below.
- Team-level totals (score, shots, passes, possession) come from Veo's automatic tracking and are independent of jersey tagging, so treat those as reliable regardless of the naming gaps above.
- Veo also has no way to detect deflections: the 34:56 goal credited to Jaden actually took a touch off a defender on the way in. Football convention would score that as an own goal, not a Jaden goal — the table below reflects that correction, though it still counts toward Lambeth Tigers' team total.
Match summary
Junior Elite struck twice inside the first half hour and looked in control. Lambeth Tigers pulled one back just before the break and equalised with 10 minutes left to salvage a 2–2 draw, despite a wasteful night in front of goal (7% conversion from 27 attempts).
Team totals
| Team | Goals | Shots | Total attempts | Conversion |
|---|---|---|---|---|
| Lambeth Tigers (attacking) | 2 | 25 | 27 | 7% |
| Junior Elite (shots faced by Tigers) | 2 | 11 | 13 | 15% |
Form & trend
Pulled from Veo's Analysis Pack, which keeps a rolling baseline across matches — the most useful comparability tool here, since it's Veo doing the normalising rather than us guessing at it.
Recent form
Last match: 3–2 win (away) vs GB10, 1 Sep — also 54% possession and 25+ attempts, so a similar profile to this one: good volume, close scoreline.
This match vs rolling baseline
| Metric | This match | Baseline |
|---|---|---|
| Conversion rate | 7.4% | 22.3% |
| Attacking-3rd possession | 27.9% | 21.9% |
| Tackles | 32 | — |
| Interceptions | 21 | 12 (JE) |
Baseline = last 10 matches (49 goals / 220 attempts). Tackles has no baseline logged yet — start tracking it match to match from here.
Shot zone — actual conversion
| Zone | Attempts | Goals | Conv. |
|---|---|---|---|
| Inside box | 6 | 1 | 16.7% |
| Outside box | 21 | 1 | 4.8% |
Only 22.2% of attempts came from inside the box. This pairs with the xG zone breakdown below — same story, different lens: too many long-range attempts, not enough combination play into the box.
Veo's narrative ratings (AI-generated, not a fixed formula)
Finishing: 3/10 — too many attempts from outside the box relative to our own baseline. · Game plan execution: 7/10 — the high press created real territory (63.4%), even though it didn't stop Junior Elite scoring twice from 13 attempts.
These are Veo's own qualitative scores rather than a counted stat like the tiles above, and there's no visibility into how consistently it grades match to match — logged here as commentary, not something to chart as a trend line.
Expected goals (xG) — estimated
Veo doesn't calculate xG natively. The estimates below are built from each team's shot map using standard zone-based conversion rates (0.10 inside the box, 0.06 from the edge/D, 0.03 from outside), so treat them as indicative rather than a certified stat — they're here because they're the best available reading of shot quality, not shot luck.
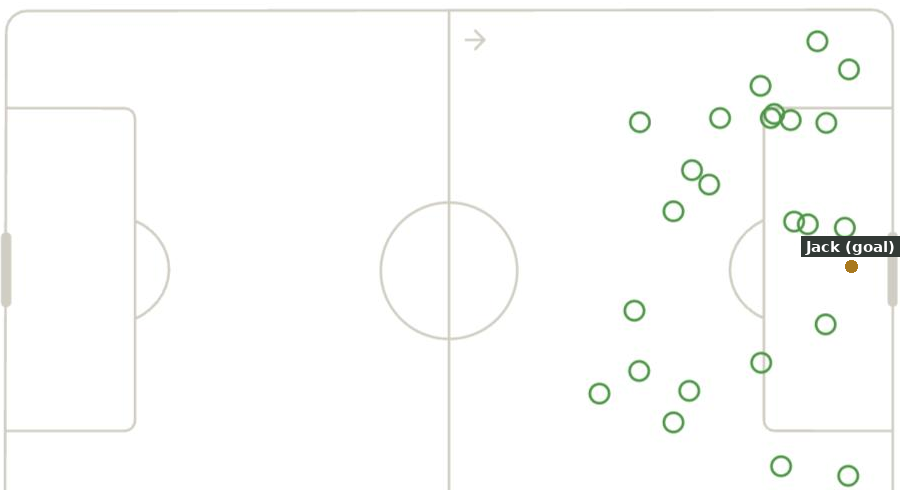
Lambeth Tigers shot map — all attempts
Zone breakdown & estimated xG
| Zone | Shots | xG/shot | Zone xG |
|---|---|---|---|
| Inside penalty box | 9 | 0.10 | 0.90 |
| Edge of box / D | 7 | 0.06 | 0.42 |
| Outside box (18yd+) | 9 | 0.03 | 0.27 |
Estimated xG ≈ 1.6 from open play, vs. 2 goals actually scored — Lambeth Tigers finished slightly above the expected rate, but the shot selection was heavily weighted toward low-percentage areas: two thirds of attempts came from the edge of the box or further out.
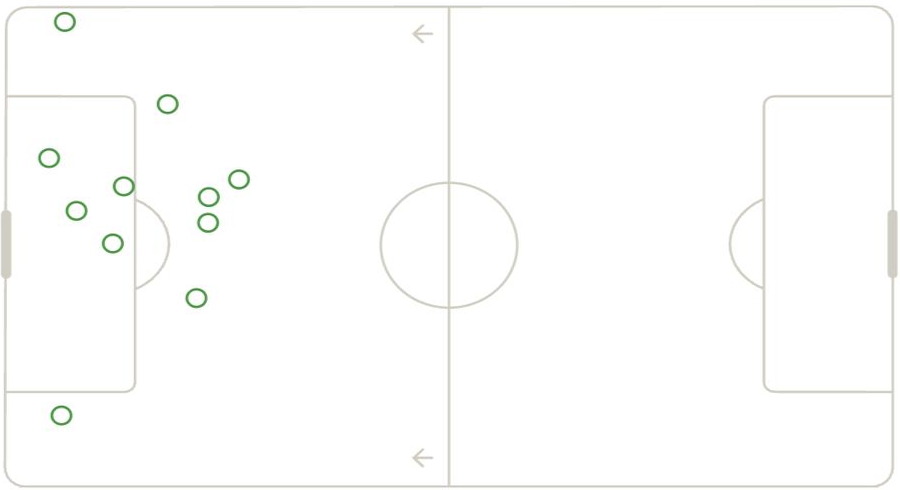
Junior Elite shot map — all attempts
Zone breakdown & estimated xG
| Zone | Shots | xG/shot | Zone xG |
|---|---|---|---|
| Inside penalty box | 5 | 0.10 | 0.50 |
| Edge of box / D | 5 | 0.06 | 0.30 |
| Outside box (18yd+) | 1 | 0.03 | 0.03 |
Estimated xG ≈ 0.8 from 11 shots, vs. 2 goals actually scored — Junior Elite's chances were of similar quality to the Tigers' (roughly half inside the box), but they were considerably more clinical: 15% conversion and a goal tally well above their expected rate, against the Tigers' 7% conversion despite more than double the shot volume.
Player breakdown
Four jersey numbers have been matched to named players. Distance and speed reflect on-pitch time, not full-match totals for subs. The remaining tagged numbers (#5, #10, #11, #13, #23) were dropped as false-positive detections — see the data quality note above. Raw totals aren't comparable across matches on their own since minutes played vary player to player — the per-90 columns are the ones to actually track over time.
| Player | Min | Shots | Goals | Conv. | Passes | Pass % | Dist (km) | Dist/min | Top speed | Sprints | Spr./90 | HI runs | HI/90 | Tackles | Int. |
|---|---|---|---|---|---|---|---|---|---|---|---|---|---|---|---|
| Jack #9 · sub | 32 | 8 | 1 | 11% | 3 | 38% | 3.8 | 119m | 28.8km/h | 4 | 11.3 | 12 | 33.8 | 2 | 1 |
| Jaden #7 | 52 | 3 | 0* | 0%* | 13 | 54% | 5.8 | 112m | 26.5km/h | 3 | 5.2 | 12 | 20.8 | 3 | 2 |
| Max #29 | 37 | 5 | 0 | 0% | 2 | 14% | 4.3 | 116m | 26.3km/h | 3 | 7.3 | 16 | 38.9 | 9 | 1 |
| Issac #2 | 55 | 4 | 0 | 0% | 19 | 56% | 5.4 | 98m | 26.7km/h | 2 | 3.3 | 14 | 22.9 | 4 | 5 |
*Jaden's shot at 34:56 was originally tagged as a goal by Veo, but took a deflection off a defender on the way in — scored here as an own goal rather than a Jaden finish (it still counts toward Lambeth Tigers' 2 team goals above and toward the "2 goals" in the xG comparison). On genuine chances, Jaden had 3 shots on target from open play without converting. Max covered the ball the most defensively (9 tackles) but didn't threaten in front of goal. Veo didn't capture Jack's goal location — it's plotted on the shot map above from memory, roughly between the penalty spot and the goal line, central. Dist/min, Spr./90 and HI/90 are calculated here (minutes-normalised) rather than pulled directly from Veo, so they can be compared safely across matches regardless of who played how long.
Fix the data next time
- Make sure every kid has a visible, correctly-sized number on their kit — Veo reads it from the video, it isn't entered by hand. This one's on hold until new kit arrives.
- In Veo's roster/lineup screen, assign real names to jersey numbers — this is what's currently missing for everyone except R S. As the only account holder, this falls to one person to do (there's no way for it to happen automatically or be split across parents), so it's realistically a case of linking numbers to names when time allows, not necessarily live on matchday.
- Once numbers + names are linked in the roster, this same report will resolve to real player names automatically on future exports — the numbers-on-kit fix is the bigger unlock of the two, since without visible numbers there's nothing for a roster entry to attach to.